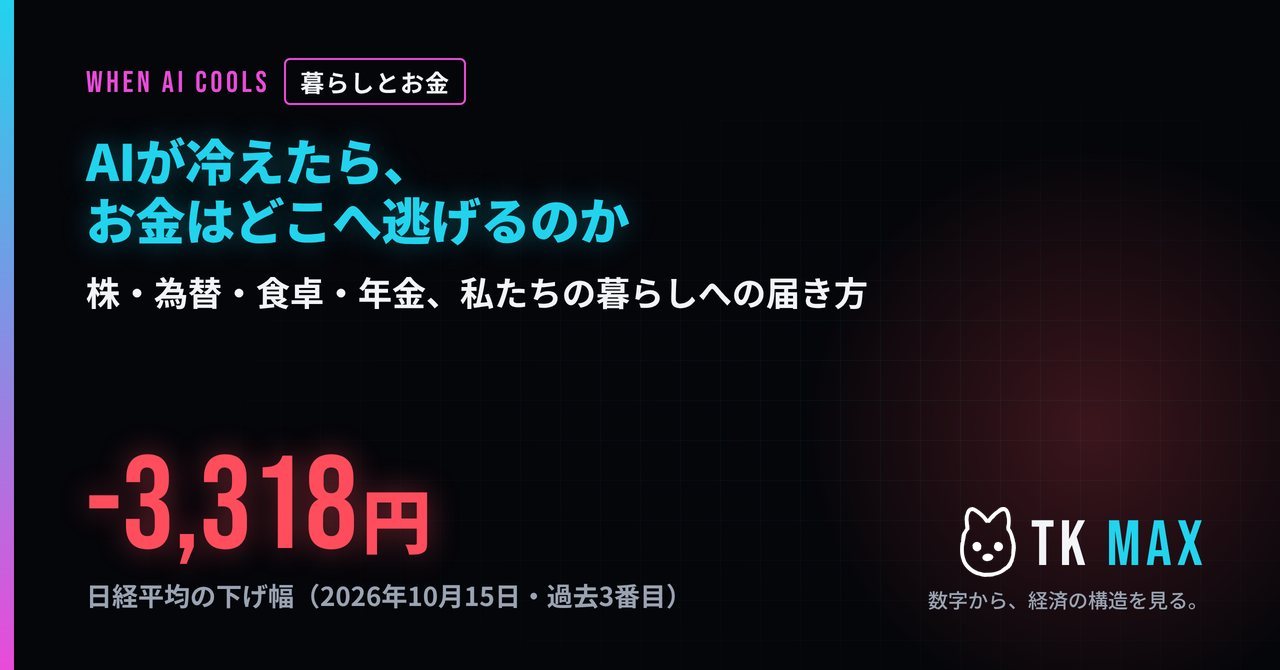
AIが冷えたら、お金はどこへ逃げるのかWhen AI Cools, Where Does the Money Run? ―― 株・為替・食卓・年金、私たちの暮らしへの届き方— How it reaches stocks, the yen, our groceries and pensions
2026年10月15日、日経平均は3,318円(−4.90%)下がりました。下げ幅は過去3番目です。きっかけは、米国のAI向けクラウド会社コアウィーブの社債が急落し、AIへの投資が借金で回っていることへの不安が表に出たことでした。ところが同じ日、東証プライムの約4割の銘柄は上がっていました。上がったのは薬、通信、日用品、たばこです。お金は市場から消えたのではなく、AIから別の場所へ移ったのです。このページは、その移動を順番に追い、それが会社員、子育て世帯、積立投資をしている若い世代、年金で暮らす人のどこに届くのかを整理します。
On October 15, 2026, the Nikkei 225 fell 3,318 yen (−4.90%) — the third-largest point drop on record. The trigger was a plunge in the bonds of CoreWeave, a US AI cloud company, which brought into the open fears that AI investment is running on debt. Yet that same day, about 40% of Prime Market stocks rose — drugmakers, telecoms, everyday goods, tobacco. The money did not vanish from the market; it moved away from AI to somewhere else. This page follows that move step by step and sorts out where it lands for salaried workers, families with children, young people saving through index funds, and people living on pensions.
📄=取引所・企業開示・公的統計や、複数の主要報道で確認された事実。📊=データの組み合わせから読み取れる関係(因果の断定ではない)。💬=専門家の間でも評価が割れている解釈。🧮=試算のために本ページが置いた仮定(公的な推計ではない)。📄 = facts from exchanges, company filings, official statistics, or confirmed by multiple major outlets. 📊 = relationships read from combined data (not a causal claim). 💬 = interpretations on which experts disagree. 🧮 = assumptions this page sets for its estimates (not official projections).
OVERVIEWお金は消えない。場所を移るだけMoney does not vanish — it changes address
📄10月14日、米コアウィーブの2032年償還の社債が額面の80セントを割り込み、利回りは発行時の9%台から一時15%まで跳ね上がりました。株価は約15.5%下落し、米国の半導体株指数は4.3%下落しました。翌15日、アジアでは韓国の総合株価指数が昼までに7%を超えて下落し、日経平均は終値で64,425円(−3,318円)まで下がりました。
📄On October 14, CoreWeave's 2032 bonds fell below 80 cents on the dollar, and their yield jumped from the 9% range at issue to as high as 15%. The stock fell about 15.5% and the US semiconductor index fell 4.3%. On the 15th, Korea's KOSPI was down over 7% by midday, and the Nikkei 225 closed at 64,425 (−3,318).
米IT大手の設備投資は、本業で稼ぐ現金を上回るペースになりました。足りない分は社債で埋めています。不安の中心は「AIが使われるか」ではなく、借りたお金を約束どおりの期間で返せるかです。
US tech giants' capital spending now outpaces the cash their businesses generate, and they fill the gap with bonds. The core worry is not whether AI gets used, but whether borrowed money can be repaid on schedule.
10月15日の日経平均の下げの大半は、アドバンテスト、東京エレクトロン、ソフトバンクGなど少数のAI・半導体株によるものでした。より幅広い銘柄を含むTOPIXの下げは日経平均の半分以下でした。「日経平均が大きく下がった」と「日本の会社が全部下がった」は同じではありません。
Most of the Nikkei's drop on October 15 came from a handful of AI and chip stocks such as Advantest, Tokyo Electron and SoftBank Group. The broader TOPIX fell less than half as much. "The Nikkei fell sharply" is not the same as "all Japanese companies fell."
同じ日に指数を押し上げたのは、医薬品、通信、日用品・小売、警備、しょうゆ、たばこでした。景気が悪くても売上が落ちにくい業種(ディフェンシブ)です。国債も買われ、長期金利は3%を下回りました。
The stocks that lifted the index that day were drugmakers, telecoms, everyday goods and retail, security services, soy sauce and tobacco — "defensive" sectors whose sales hold up even in a downturn. Government bonds were bought too, pushing the long-term yield below 3%.
株を持つ人には損になります。一方で、もし円高が進めば輸入品は安くなり、株を持たない人の食卓には追い風になりえます。ただし、円高になるかどうかは専門家の間でも見方が割れています。10月15日の円の上昇は0.48円にとどまりました。
For those holding stocks it is a loss. But if the yen strengthens, imports get cheaper — a possible tailwind for the grocery bills of people without stocks. Whether the yen will strengthen, however, divides experts: on October 15 the yen rose only 0.48 yen.
このページの読み方How to read this page
- 「02 震源」「03 直撃する場所」で、何が起きていて、どこが一番揺れるのかを確認します。
- 「04 お金の逃げ先」「05 歴史が示すこと」で、お金がどこへ移るのか、過去の暴落で何が持ちこたえたのかを見ます。
- 「06 為替の逆回転」で、円高になる場合とならない場合を整理します。
- 「07 立場別の届き方」「08 暮らしの試算」で、自分に近い立場を選んで影響を確かめます。
- "02 The Epicenter" and "03 Where It Hits" show what is happening and where the shaking is strongest.
- "04 Where Money Runs" and "05 What History Shows" show where money moves and what held up in past crashes.
- "06 The Currency Twist" sorts out the cases where the yen strengthens — and where it doesn't.
- "07 By Who You Are" and "08 Household Simulator" let you pick the situation closest to yours and check the impact.
THE EPICENTER稼ぐ現金より、使う現金の方が多くなったSpending more cash than they earn
AIを動かすには、半導体を大量に詰め込んだデータセンターが必要です。米IT大手は2026年、その建設に過去にない規模のお金を投じています。
Running AI requires data centers packed with chips. In 2026 the US tech giants are pouring unprecedented sums into building them.
| 会社Company | 2026年の設備投資見通し2026 capex guidance | メモNote |
|---|---|---|
| Amazon | 約2,200億ドル~$220B | 7月に上方修正(従来 約2,000億ドル)Raised in July (from ~$200B) |
| Alphabet(Google) | 1,950〜2,050億ドル$195–205B | 6月に約850億ドルの株式による資金調達も実施Also raised ~$85B in equity in June |
| Microsoft | 約1,750億ドル~$175B | 会計上の耐用年数変更で数字は下がったが、投資計画は変わらずと説明Figure lowered by a useful-life accounting change; plans described as unchanged |
| Meta | 1,300〜1,450億ドル$130–145B | 5月に250億ドルの社債を発行Issued $25B of bonds in May |
| Oracle | — | 2026年度に430億ドルを借入。フリーキャッシュフローはマイナス。格付けはBBB・見通しネガティブBorrowed $43B in FY26; free cash flow negative; rated BBB, negative outlook |
📄4社合計 7,200〜7,450億ドル(2026年7月下旬の決算発表時点の会社見通し)。Oracleを加えると8,000億ドル規模との集計もあります。Four-company total: $720–745B (company guidance at late-July 2026 earnings). Some tallies put it near $800B including Oracle.
対象:Alphabet・Amazon・Meta・Microsoft・Oracle。2025年と2026年1〜3月はS&P集計、8月10日までは BNPパリバ集計(ロイター報道)。Covers Alphabet, Amazon, Meta, Microsoft and Oracle. 2025 and Q1 2026 per S&P; through Aug 10 per BNP Paribas (via Reuters).
フリーキャッシュフローは、本業で入った現金から設備投資を引いた残りです。FactSetの集計(7月)では、2026年度は5社のうちAlphabetとMicrosoftを除く3社がゼロ近辺かマイナスになる見通しでした。自分の稼ぎだけでは投資を賄えず、借金や株の発行に頼る段階に入ったということです。
Free cash flow is cash from operations minus capital spending. FactSet's July tally expected FY2026 free cash flow near zero or negative for three of the five — all but Alphabet and Microsoft. They can no longer fund investment from their own earnings and have entered a phase of relying on debt and share issuance.
巨大企業は格付けが高く、まだ有利な条件で借りられます。苦しいのは、格付けの低いジャンク債でお金を集めてデータセンターを建てる新興の会社です。コアウィーブは6月末で約1,042億ドルの受注残を持ちながら、借金の利払いと返済が先に来る構造が嫌われました。保証料にあたるCDSのスプレッドは10%を超え、不安はOracleやソフトバンクGにも広がりました。
The giants have high ratings and can still borrow on good terms. The squeeze is on newer companies that build data centers with low-rated junk bonds. CoreWeave held about $104.2B in contracted backlog at end-June, yet investors balked at a structure where interest and repayments come first. Its CDS spread — the price of default insurance — topped 10%, and the worry spread to Oracle and SoftBank Group.
経済学者ハイマン・ミンスキーは、借金で膨らんだ好景気は、ある日「返せないのでは」という疑いをきっかけに一気に逆回転すると考えました。その瞬間を「ミンスキー・モーメント」と呼びます。今回がその入口なのか、一時的な調整なのかは、まだ誰にも分かりません。10月下旬からの米IT大手の決算が、次の分かれ道とみられています。
Economist Hyman Minsky argued that a debt-fueled boom can suddenly reverse once doubts arise about repayment — the "Minsky moment." Whether this is the entrance to one or a passing correction, no one yet knows. US tech giants' earnings from late October are seen as the next fork in the road.
借金の連鎖の全体像(OpenAI・ソフトバンクG・Oracle)は、関連ダッシュボード「5,000億ドルの借用書」で詳しく扱っています。The full debt chain (OpenAI, SoftBank Group, Oracle) is covered in the related dashboard "The $500 Billion IOU."
WHERE IT HITS揺れは、AIに近い順に大きいThe closer to AI, the harder the shaking
韓国・台湾は15日午前11時ごろの値。韓国はメモリー大手(SKハイニックス・サムスン電子)の比重が大きく、最も大きく揺れました。Korea and Taiwan are values around 11 a.m. on the 15th. Korea, heavy in memory giants SK Hynix and Samsung, shook the most.
前引け時点で日経平均は3,255円安。上の7銘柄だけで約2,590円分、下げの約8割を占めました。At midday the Nikkei was down 3,255 yen; these seven stocks alone accounted for about 2,590 yen — roughly 80% of the drop.
揺れが広がる順番The order in which the shaking spreads
📊RING 1〜2は10月15日の値動きで確認できる範囲。RING 3〜5は、AI投資の縮小が長引いた場合に広がりうる経路です。政府は2030年度までにAI・半導体へ10兆円以上の公的支援を行う方針で、熊本や北海道の工場・データセンター計画は地域の雇用とも結びついています。Rings 1–2 are visible in the October 15 moves. Rings 3–5 are paths that could open if the AI pullback drags on. The government plans over ¥10 trillion of public support for AI and chips through FY2030, and plant and data-center projects in Kumamoto and Hokkaido are tied to regional jobs.
WHERE MONEY RUNS3,318円安の日に、上がっていたものWhat rose on the day the Nikkei fell 3,318 yen
水色=医薬品・医療機器、緑=通信・小売・日用品・娯楽・警備、黄=たばこ。押し下げ(アドバンテスト1銘柄で約1,213円)と比べると上げ幅はごく小さく、指数を支えるほどではありません。それでも「どこへ移ったか」ははっきり表れています。Cyan = pharma and medical devices; green = telecom, retail, everyday goods, entertainment, security; amber = tobacco. The lifts are tiny next to the drags (Advantest alone ~1,213 yen) and could not hold up the index — but they show clearly where the money went.
逃げ先の地図A map of the escape routes
| 逃げ先Destination | なぜ選ばれるかWhy money goes there | 10月15日の動きOn Oct 15 |
|---|---|---|
| ディフェンシブ株Defensive stocks | 薬・通信・食品・たばこ・電力など、景気が悪くても売上が落ちにくいDrugs, telecom, food, tobacco, utilities — sales hold up in a downturn | 📄医薬品・不動産・小売など10業種が上昇10 sectors including pharma, real estate and retail rose |
| 国債Government bonds | 国が元本と利息を払う。株が不安なときの定番の避難先State pays principal and interest — the standard refuge when stocks wobble | 📄日本の長期金利が3%を下回る(国債が買われた)Japan's long-term yield fell below 3% (bonds were bought) |
| 円The yen | 危機のときに買われやすい通貨とされてきたTraditionally bought in a crisis | 📄157円台後半。前日比0.48円の円高にとどまるHigh-157 range — only 0.48 yen stronger than the day before |
| 米国のディフェンシブ株US defensives | 同じ動きは米国でも起きているThe same move is happening in the US | 📊たばこ大手フィリップ・モリスの株価が7月の高値(207.76ドル)に迫り、時間外で上抜けTobacco giant Philip Morris approached its July high ($207.76) and broke above it in pre-market trading |
| 現金・預金Cash and deposits | 値動きがない。ただし物価が上がる局面では目減りするNo price swings — but it loses value when prices rise | 📊市場全体が一斉に現金化した動きではなかった(プライムの約36%が上昇)Not a market-wide dash for cash (about 36% of Prime stocks rose) |
投資の世界では、危ない資産から安全な資産へお金が移ることを「質への逃避」と呼びます。今回はさらに、AIのように「将来の成長」に高い値段がついた株から、今すでに安定して現金を稼いでいる地味な株(バリュー株)へお金が移る動きが目立ちました。こうした株は、ふだんはAI株ほど話題になりません。
In investing, money moving from risky to safe assets is called a "flight to quality." This time there was also a clear move from stocks priced high for future growth, like AI, to plain stocks that already earn steady cash today ("value stocks") — the kind that rarely make headlines next to AI names.
お金が一斉に集まれば、ディフェンシブ株も割高になります。国債も、金利が再び上がれば値下がりします。逃げ先はあくまで「相対的に揺れが小さい場所」であり、損をしない場所ではありません。
If money piles in all at once, defensive stocks become expensive too. Bonds also fall in price if rates rise again. Escape routes are places that shake relatively less — not places where you cannot lose.
WHAT HISTORY SHOWSハイテクが落ちたとき、何が持ちこたえたかWhen tech fell, what held up
| 出来事Event | 何が落ちたかWhat fell | 何が持ちこたえたかWhat held up | 円はどう動いたかWhat the yen did |
|---|---|---|---|
| ITバブル崩壊(2000〜02年)Dot-com bust (2000–02) | ナスダック約−78%、S&P500約−49%Nasdaq ~−78%, S&P 500 ~−49% | たばこ・公益・生活必需品などの割安株が上昇Value stocks such as tobacco, utilities and staples rose | 円安Weaker(日本自身の不況・金融不安) (Japan's own slump and banking stress) |
| リーマン危機(2008年)Lehman crisis (2008) | 日経平均 年間約−42%Nikkei ~−42% for the year | 国債・円・金Government bonds, yen, gold | 円高Stronger(夏の110円前後→年末に80円台) (~¥110 in summer → ¥80s by year-end) |
| 金利上昇ショック(2022年)Rate shock (2022) | ナスダック約−33%Nasdaq ~−33% | エネルギー株(約6割上昇)、生活必需品Energy stocks (up ~60%), staples | 円安Weaker(日米金利差の拡大、115円→150円台) (wider rate gap, ¥115 → ¥150s) |
| 令和のブラックマンデー(2024年8月5日)"Reiwa Black Monday" (Aug 5, 2024) | 日経平均 −4,451円(−12.4%)、過去最大の下げ幅Nikkei −4,451 (−12.4%), the largest point drop ever | 数日で大半を回復Most of it recovered within days | 円高Stronger(7月の161円台→141円台、円売りの巻き戻し) (¥161 in July → ¥141, unwinding of yen-short trades) |
| コアウィーブ・ショック(2026年10月15日)CoreWeave shock (Oct 15, 2026) | 日経平均 −3,318円(−4.90%)、過去3番目Nikkei −3,318 (−4.90%), 3rd largest | 医薬品・通信・小売・たばこ、国債Pharma, telecom, retail, tobacco, bonds | ほぼ横ばい(+0.48円)Nearly flat (+0.48 yen) |
📄数値は各指数の高値から安値、または年間の騰落の概数です。Figures are approximate peak-to-trough or calendar-year moves for each index.
どの局面でも、人が毎日使う薬、食べ物、電気、通信、そしてたばこを売る会社は、相対的に持ちこたえてきました。景気が悪くなっても、人は薬を飲み、ご飯を食べ、電話を使うからです。
In every episode, companies selling things people use daily — medicine, food, power, phone service, and tobacco — held up relatively well. People keep taking medicine, eating and making calls even in a downturn.
2008年と2024年は円高になりましたが、2000年代初めと2022年は逆に円安でした。円が「逃げ先」になるかどうかは、そのとき日本の側に何が起きているか(金利、景気、金融不安)で変わります。「AIが崩れれば必ず円高」とは言えません。
The yen strengthened in 2008 and 2024, but weakened in the early 2000s and in 2022. Whether the yen becomes an escape route depends on what is happening on Japan's side at the time (rates, the economy, financial stress). It cannot be said that "if AI collapses, the yen will surely rise."
2000年のネット企業の多くは利益がほとんどありませんでした。今の米IT大手は巨額の利益を出しており、その点は大きく違います。一方で、S&P500の上位10社が指数の約4割を占めるという「一極集中」は、過去にない水準です。崩れるかどうかより、崩れたときの影響が広いことが今回の特徴です。
Many dot-com companies in 2000 had little or no profit. Today's US tech giants earn enormous profits — a big difference. Yet the concentration, with the top 10 companies making up about 40% of the S&P 500, is unprecedented. What stands out this time is less whether it breaks than how widely it would be felt if it does.
THE CURRENCY TWIST株で損をして、食卓で得をする?Lose on stocks, gain at the grocery store?
AI株が崩れたときに円がどう動くかで、暮らしへの届き方は大きく変わります。米国株の専門家の一部には「バブルが崩れたときにドルが急騰するという説は誤りで、むしろ米国からお金が引き揚げられてドルが売られる」とする見方があります。
How the yen moves when AI stocks break makes a big difference to how it reaches daily life. Some US-equity specialists argue that "the idea that the dollar spikes when a bubble bursts is wrong — money will be pulled out of the US and the dollar sold."
- 米国株の下落で、外国人投資家が米国から資金を戻す。
- FRBが景気を支えるために利下げに動けば、日米の金利差が縮む。
- 2008年、2024年8月は実際に急激な円高になった。
- Falling US stocks lead foreign investors to bring money home.
- If the Fed cuts rates to support the economy, the Japan–US rate gap narrows.
- In 2008 and August 2024 the yen did surge.
- 米国の物価が高止まりし、FRBが利下げできない(9月の米物価は予想を上回った)。
- デジタル関連の海外への支払いやエネルギー輸入など、円を売る構造的な流れは変わらない。
- 10月15日の円の上昇は0.48円にとどまった。
- US inflation stays high and the Fed cannot cut (September US prices beat forecasts).
- Structural yen-selling flows — payments abroad for digital services, energy imports — do not change.
- On October 15 the yen rose only 0.48 yen.
円高で輸入品が安くなっても、店頭の値下げは値上げより遅く、小さい傾向があります。一方で、株や投資信託の値下がりは、その日のうちに評価額に表れます。損は「すぐ・大きく」、得は「遅く・小さく」届くという時間差があります。「08 暮らしの試算」で、両方を並べて確かめられます。
Even when a strong yen makes imports cheaper, price cuts in shops tend to come slower and smaller than price hikes. Falls in stocks and funds show up in your balance the same day. Losses arrive fast and big; gains arrive late and small — a time gap. You can compare both side by side in "08 Household Simulator."
円安がどの道を通って家計に届くかは、関連ダッシュボード「円安は、誰の食卓に届くのか」で詳しく扱っています。このタブはその逆回転の話です。How a weak yen reaches households is covered in the related dashboard "Where Does the Weak Yen Land?" This tab is about the same mechanism running in reverse.
BY WHO YOU ARE同じ暴落でも、届く道は人によって違うSame crash, different roads to your door
AI株の下落が暮らしに届く道は、主に4つあります。投資(NISA・iDeCo・企業年金)、仕事(給料・ボーナス・雇用)、物価(為替経由の食卓・電気代)、公的年金の積立金です。どの道が太いかは立場によって変わります。下の色は、AI株が大きく下がった場合に影響が大きい順(赤→黄→緑)の目安です。
There are four main roads by which falling AI stocks reach daily life: investments (NISA, iDeCo, company pensions), work (pay, bonuses, jobs), prices (food and power bills via the yen), and public pension reserves. Which road is widest depends on who you are. The colors below are a rough guide to how strongly each is felt if AI stocks fall sharply (red → amber → green).
🧮色分けは本ページの整理による目安です。個々の家計の状況によって変わります。The color coding is this page's rough guide and varies with each household's situation.
- 📄人気の全世界株の投資信託(オルカン、純資産約14.3兆円)は、上位10銘柄だけで約25%。1位はNVIDIA(5.0%)、2位Apple、3位Microsoftです。「世界に分散している」つもりでも、AI大手の値動きの影響を大きく受けます。
- 💬積み立てを続ける期間が長い人にとって、下落局面は「同じ金額で多く買える期間」でもある、という見方があります。一方で、下落が長引けば気持ちの面で続けにくくなるという指摘もあります。
- 📄The popular all-world equity fund (eMAXIS Slim "All Country," ~¥14.3T in assets) has about 25% in its top 10 holdings alone — NVIDIA (5.0%), then Apple and Microsoft. Even if you think you are "diversified worldwide," AI giants move your balance a lot.
- 💬For those with many years of saving ahead, a downturn is also "a period when the same amount buys more," some argue. Others note that a long slump makes it emotionally hard to keep going.
- 📊勤め先が半導体・電子部品・電線など「AIの部品」に関わる会社なら、業績を通じてボーナスに響く可能性があります。関わりの薄い業種なら、影響は株価ほど大きくありません。
- 💬10月15日は国債が買われ、長期金利が3%を下回りました。この流れが続けば、固定型の住宅ローン金利の上昇が一服する可能性があります。ただし日銀の利上げ方針しだいで、変動型への影響は別です。
- 📊If your employer makes "parts for AI" — chips, electronic components, cables — bonuses may feel it through earnings. In unrelated industries the effect is far smaller than stock prices suggest.
- 💬On October 15 bonds were bought and the long-term yield fell below 3%. If that continues, rises in fixed-rate mortgage rates could pause. Variable rates depend separately on the BOJ's rate path.
- 📊積み上げた残高が大きいほど、同じ下落率でも金額の損は大きくなります。NISA・iDeCo・企業型確定拠出年金のどれも、中身が株式中心なら同じ波を受けます。
- 📊一番の注意点は「順番」です。取り崩しを始める直前や直後に大きな下落が重なると、回復を待つ時間が短くなります。この問題は関連ダッシュボード「暴落を知らないまま、老後に突入する」で試算できます。
- 📊The larger the balance you have built, the bigger the yen loss from the same percentage drop. NISA, iDeCo and corporate DC plans all ride the same wave if they hold mostly stocks.
- 📊The key risk is sequence: a big drop just before or after you start withdrawing leaves less time to wait for recovery. The related dashboard "Entering Retirement Without Knowing a Crash" lets you test this.
- 📊熊本・北海道などの半導体工場やデータセンターの計画は、建設、運送、飲食、住宅まで地域の仕事を生んでいます。AI投資の縮小が長引けば、計画の延期を通じて地元に届く可能性があります。
- 💬円高になれば、輸入原材料や燃料が安くなり、価格転嫁に苦しむ中小企業には一息つける面もあります。ただし輸出企業の下請けにとっては逆風です。
- 📊Chip plants and data centers planned in Kumamoto, Hokkaido and elsewhere create local work in construction, logistics, restaurants and housing. A prolonged AI pullback could reach these towns through delayed projects.
- 💬A stronger yen would cheapen imported materials and fuel, giving some relief to small firms struggling to pass on costs — but it is a headwind for exporters' suppliers.
- 📄公的年金の積立金(GPIF)は2026年6月末で約317.8兆円。資産のおよそ半分が国内外の株式です。株が下がれば評価額は大きく動きます。
- 📄ただし、積立金の評価損で、今受け取っている年金額がすぐに減る仕組みではありません。年金額は物価・賃金に合わせた改定ルールで決まります。影響が出るとすれば、長い目で見た年金財政の見通しを通じてです。
- 💬預金が中心なら株価の直撃は小さく、円高が進めば食卓の値上がりが和らぐ可能性もあります。
- 📄The public pension reserve fund (GPIF) held about ¥317.8 trillion at end-June 2026, roughly half in domestic and foreign stocks. Its value swings a lot when stocks fall.
- 📄But valuation losses do not immediately cut the pensions people receive now. Pension amounts follow revision rules tied to prices and wages. Any effect would come through the long-term outlook for pension finances.
- 💬With savings mostly in deposits, the direct hit from stock prices is small — and if the yen strengthens, grocery price rises may ease.
- 「日経平均が何千円下がった」というニュースは、AI関連の少数の銘柄の動きに大きく引っ張られています。自分の資産や仕事がAIとどれだけ関わっているかで、受ける影響はまったく違います。
- 投資をしていない人も、年金積立金と為替を通じて無関係ではありません。ただし、その届き方は株を持つ人よりずっと遅く、穏やかです。
- Headlines like "the Nikkei fell thousands of yen" are driven heavily by a handful of AI stocks. How much you are affected depends entirely on how closely your assets and job are tied to AI.
- Even people who don't invest are connected through pension reserves and the yen — but those effects arrive far more slowly and gently than for stockholders.
HOUSEHOLD SIMULATORAI株が下がり、円が動いたら、暮らしの数字はどう変わるかIf AI stocks fall and the yen moves, how do your numbers change?
計算方法と前提(クリックで開く)Method and assumptions (click to open)
① 円高率は(158÷設定レート)−1。② 日経平均:AI関連の比重を35%とし、AI関連は設定した下落率で、それ以外の65%は下落率の30%分(連れ安)に加え、円高1%につき0.4%下がるとしました。③ 投資信託:全世界株のうちAI関連の比重を30%とし、それ以外の70%は下落率の35%分下がるとしました。そのうえで、円高の分だけ円換算の評価額が目減りします。④ 食料+光熱費:円安1%あたりの値上がり率を食料0.15・光熱0.35(約1年後)とし、円高側は値下がりが遅く小さい傾向を踏まえて効果を半分にしました。⑤ GPIF:約317.8兆円を国内債券・国内株式・外国債券・外国株式に4分の1ずつと見なし、国内株式は日経平均、外国株式は④の投資信託、外国債券は為替の分だけ動くとしました。
月の食料/光熱費:20〜30代単身 4.5万/0.9万円、子育て・会社員世帯 9.0万/2.2万円、50代夫婦 8.5万/2.3万円(家計調査をもとに丸めた値)、年金世帯 78,964円/23,540円(家計調査2025年・高齢夫婦無職世帯)。
これらの比重・係数はすべて🧮本ページの想定です。実際の値動きは、銘柄の入れ替え、配当、金利、各国の政策などで大きく変わります。
① Yen appreciation = (158 ÷ rate) − 1. ② Nikkei: AI-related weight 35%, falling by the set rate; the other 65% falls by 30% of that rate (contagion) plus 0.4% per 1% of yen appreciation. ③ Fund: AI-related weight 30% of an all-world index; the other 70% falls by 35% of the set rate. The yen-converted value then shrinks by the yen's appreciation. ④ Food + utilities: price rise per 1% depreciation of 0.15 (food) and 0.35 (utilities) after ~1 year; on the appreciation side the effect is halved, since price cuts come slower and smaller. ⑤ GPIF: ~¥317.8T treated as one quarter each in domestic bonds, domestic stocks, foreign bonds and foreign stocks; domestic stocks follow the Nikkei, foreign stocks follow the fund in ③, foreign bonds move with the currency only.
Monthly food / utilities: single 20s–30s ¥45k / ¥9k; salaried family ¥90k / ¥22k; 50s couple ¥85k / ¥23k (rounded from the household survey); retired couple ¥78,964 / ¥23,540 (2025 survey, retired older couples).
All weights and coefficients are 🧮this page's assumptions. Real moves vary greatly with index changes, dividends, rates and policy.
※試算は教育・研究目的の目安であり、将来の株価・為替・物価を予測するものではありません。特定の金融商品の売買を勧めるものでもありません。*Estimates are rough guides for education and research, not forecasts of stock prices, exchange rates or prices, and not a recommendation to buy or sell any financial product.
BOTH SIDES & SOURCES「バブル」か「本物の成長」か"Bubble" or "real growth"?
- 米IT大手は巨額の利益を出しており、2000年のネット企業とは体力が違う。
- コアウィーブだけでも1,000億ドルを超える受注残があり、AIの需要そのものは強い。
- 10月15日も台湾TSMCの7〜9月期決算は予想を上回った。
- 下落は行き過ぎた期待の調整で、AIが仕事の生産性を上げる流れは変わらない。
- US tech giants earn huge profits — far sturdier than dot-com firms in 2000.
- CoreWeave alone has over $100B in backlog; demand for AI itself is strong.
- On October 15, TSMC's July–September results beat expectations.
- The fall is a correction of excess expectations; AI's boost to productivity continues.
- 設備投資が稼ぐ現金を上回り、借金と株の発行で賄う段階に入った。
- 社債の発行額が1年で3倍以上に膨らみ、借り入れの条件も悪くなっている。
- AI企業同士が出資し合い、互いの売上を作る「循環取引」への疑問がある。
- 株価指数の一極集中が過去にない水準で、崩れたときの影響が広い。
- Capex now exceeds cash earned, funded by debt and new shares.
- Bond issuance has more than tripled in a year, on worsening terms.
- Questions over "circular deals" in which AI firms invest in each other and create each other's revenue.
- Index concentration is unprecedented, so a break would be widely felt.
このページは、AIバブルが崩れると予想するものではありません。崩れた場合に、お金がどこへ移り、それが誰の暮らしのどこに届くのかを、立場ごとに整理したものです。「冷える」程度で済むのか、本格的な崩壊になるのかで、届き方の大きさはまったく違います。
This page does not predict that the AI bubble will burst. It sorts out, by situation, where money would move if it did and where that would reach people's lives. Whether it merely "cools" or truly collapses makes an entirely different difference to the impact.
出典Sources
- 日本経済新聞「日経平均3318円安 『コアウィーブ・ショック』で下げ幅歴代3位」(2026年10月15日)Nikkei, "Nikkei falls 3,318 yen on 'CoreWeave shock'" (Oct 15, 2026) nikkei.com
- 時事通信「日経平均株価は3318円安と、過去3番目の下げ幅」(同日)Jiji Press, Nikkei's third-largest drop (same day) jiji.com
- 株探「明日の株式相場に向けて=『コアウィーブ・ショック』収束の条件を探る」Kabutan, conditions for the CoreWeave shock to settle kabutan.jp
- 株探「日経平均は大幅続落、アドバンテが約1213円分押し下げ」(前引けの寄与度)Kabutan, Nikkei midday contributions kabutan.jp
- 株探「アジア株下落、韓国CB発動目前」Kabutan, Asian stocks fall kabutan.jp
- 東京株式市場の終値(TOPIX・業種別の騰落)Tokyo market close (TOPIX, sector moves) newage3.net
- ブルームバーグ「AIクラウドのコアウィーブに信用不安、社債・株急落」/「日経平均3000円安、コアウィーブ懸念-金利低下、円上昇」Bloomberg, CoreWeave credit fears; Japan market wrap bloomberg.com / bloomberg.com
- アゴラ「米AIクラウド『コアウィーブ』社債の暴落で日米株価が続落」Agora, CoreWeave bond plunge agora-web.jp
- 楽天証券トウシル「日経平均大幅安、コアウィーブ社債急落で信用不安」Rakuten Securities, market participants' views rakuten-sec.net
- NHK「円相場 値上がり 日銀委員の発言など受け」(10月15日)NHK, yen rises (Oct 15) nhk.or.jp
- FactSet, "Hyperscalers Tap External Financing as AI Capex Outruns Cash Flow" (Jul 2026) factset.com
- TMT Finance, "2026 hyperscaler capex tops US$700bn" (Aug 2026) tmtfinance.com
- 米IT大手の社債発行額(BNPパリバ・S&P集計のまとめ)Hyperscaler bond issuance (BNP Paribas and S&P data) mlq.ai
- 大和アセットマネジメント「NISA口座の動向」(2026年9月)Daiwa Asset Management, NISA account trends (Sep 2026) daiwa-am.co.jp
- eMAXIS Slim 全世界株式(オール・カントリー)組入上位銘柄(2026年9月30日)・純資産(10月14日)eMAXIS Slim All Country: top holdings (Sep 30, 2026), net assets (Oct 14) wealthadvisor.jp
- 第一生命経済研究所「GPIF 2026年4〜6月期の運用実績」Dai-ichi Life Research Institute, GPIF Apr–Jun 2026 results dlri.co.jp
- S&P500上位10社の比率の推移S&P 500 top-10 weight over time landmarkwealthmgmt.com
- 野村総合研究所 木内登英「AI・半導体に10兆円以上の公的支援」NRI (Takahide Kiuchi), ¥10T+ public support for AI and chips nri.com
- 2024年8月5日の株価急落(マネックス証券)The Aug 5, 2024 crash (Monex) monex.co.jp
- Wikipedia, "Dot-com bubble" wikipedia.org
データは2026年10月15日時点の公開情報に基づきます。株価・為替は日々動くため、最新の数字は各出典でご確認ください。Data reflect public information as of October 15, 2026. Prices and rates move daily; check each source for the latest figures.
※本ページは公開データ・報道をもとにした教育・研究目的の分析です。特定の金融商品の売買や投資判断を推奨・示唆するものではなく、投資助言ではありません。シミュレーターの数値は本ページの想定に基づく目安であり、将来の株価・為替・物価・年金額を予測するものではありません。
*This page is an educational and research analysis based on public data and reporting. It does not recommend or imply buying or selling any financial product or any investment decision and is not investment advice. Simulator figures are rough guides based on this page's assumptions, not forecasts of future stock prices, exchange rates, prices or pensions.